Disply MRI Data using MATLAB
The example of scalar data includes magnetic resonance imaging (MRI) data. This data typically contains a number of slice planes taken through a volume, such as the human body. MATLAB includes an MRI data set that contains 27 image slices of a human head. This example illustrate the following techniques applied to MRI data:
A series of 2-D images representing slices through the head
2-D and 3-D contour slices taken at arbitrary locations within the data
An isosurface with isocaps showing a cross section of the interior
To give you a flavor of the game, here is an excerpt from one run
. Ways to Display MRI Data:
Changing the Data Format
Displaying Images of MRI Data
Displaying a 2-D Contour Slice
Displaying 3-D Contour Slices
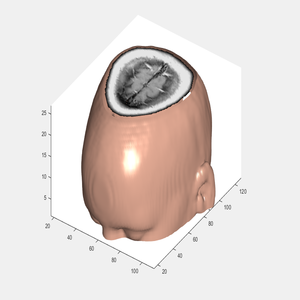
Applying an Isosurface to the MRI Data
Adding Isocaps Show Cut-Away Surface
Defining the View
Add Lighting.
Using Scalar Volume Data

<--------------------Scalar Volume Data------------------------>
Typical scalar volume data is composed of a 3-D array of data and three coordinate arrays of the same dimensions. The coordinate arrays specify the x-, y-, and z-coordinates for each data point.
<------------------------------------------------>

The isocaps use interpolated face coloring, which means the figure colormap determines the coloring of the patch. This example uses the colormap supplied with the data.

To display isocaps at other data values, try changing the isosurface value or use the sub volume command.


You can see complete source file at the [Attaullah's GitHub Repository](https://github.com/attaullahshafiq10/Display-MRI-Data).
Source: MRI Data using MATLAB